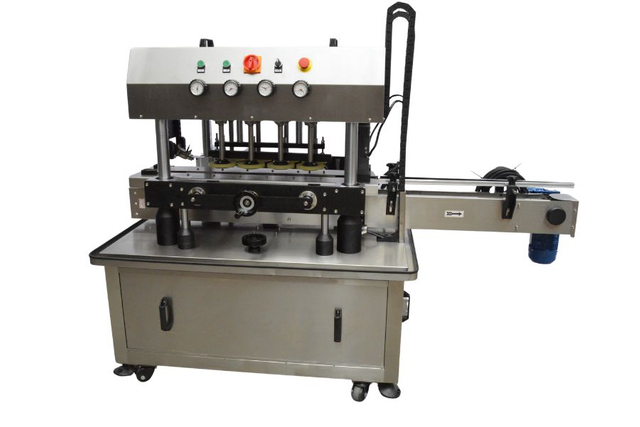
Energy-efficient automatic packaging machines reduce electricity use, packaging waste, compressed-air demand, and rejected output at the same time. In a plant running 6,000 hours per year, cutting average machine demand from 20 kW to 16 kW saves 24,000 kWh annually on one line. A 1% reduction in packaging material also removes 10 tonnes of material for every 1,000 tonnes purchased. Modern servo systems, controlled heating, automatic standby, accurate filling, and production monitoring make those reductions measurable while maintaining output. The useful number is energy and material consumed per accepted package, not simply the machine’s rated power.
Packaging deserves attention because production lines often run two or three shifts for 4,000–8,000 hours each year. A packaging machine may use electricity for motors, conveyors, heaters, pumps, controls, vacuum generation, and compressed air while also determining how much film, container material, adhesive, or product becomes waste. Improving only one component can therefore give an incomplete result.
That broader view changes how equipment should be compared. A 15 kW machine producing 120 accepted packs per minute uses about 2.08 Wh per pack at full output, while an 18 kW machine producing 180 accepted packs per minute uses about 1.67 Wh. The second machine has 20% higher instantaneous demand but roughly 20% lower electricity consumption per finished pack.
Energy per accepted unit is more useful than connected power because speed, reject rate, idle time, and product changeovers all affect the electricity actually required to ship one finished package.
Once consumption is measured per accepted unit, motor technology becomes easier to assess. Servo-controlled axes can move film, containers, sealing jaws, dosing mechanisms, and capping heads only when the production cycle requires movement. Older continuously running mechanical arrangements may keep several components moving during short production interruptions, so a 10% reduction in non-productive operating time can matter across 6,000 annual hours.
Motion efficiency also affects maintenance. Accurate electronic synchronization reduces repeated mechanical adjustment and can limit unnecessary acceleration, braking, and contact between components. A plant losing 30 minutes per 8-hour shift to adjustments gives up more than 180 production hours over 360 operating days, before counting the electricity consumed while auxiliary systems remain switched on.
Thermal processes add another measurable area. Heat-sealing equipment must keep sealing surfaces within a suitable temperature range for the selected film; excessive temperature wastes electricity and may increase damaged seals, while insufficient temperature can produce leaks. Modern controllers continuously compare measured temperature with the setpoint rather than supplying maximum heater output throughout an 8-, 16-, or 24-hour production period.
A packaging line drawing 8 kW through its heating circuits does not necessarily consume 8 kWh every operating hour because heaters cycle according to thermal demand. Better insulation, smaller heated mass, controlled standby temperatures, and fast-response heating can reduce the time heating elements remain energized. Even a 15% reduction in average heater consumption equals 7,200 kWh annually when the original thermal demand averages 8 kW for 6,000 hours.
Material accuracy can produce equally large numerical differences:
-
Reducing film by 0.5 g on 20 million packs saves 10,000 kg per year.
-
Lowering container or closure rejects from 2.0% to 1.0% prevents 100,000 rejects per 10 million units.
-
Cutting a 300 mm film repeat by 3 mm reduces film length by 1%; at 10 million cycles, that removes 30 km of film.
-
Improving accepted output from 97% to 99% produces about 20,000 more accepted packs for every 1 million cycles without increasing the planned cycle count.
Material reduction depends on machine repeatability rather than simply specifying thinner packaging. Registration sensors, accurate film feeding, controlled tension, stable sealing pressure, and repeatable cutting positions allow engineers to work closer to the required package dimensions. A 1% reduction that appears minor during a 30-minute test becomes financially and environmentally relevant after millions of annual cycles.
Product loss needs the same attention because the contents can carry more manufacturing input than the package. If a filling line handles 250 ml containers and overfills by an average of 2 ml, every 1 million containers consumes an additional 2,000 litres of product. Reducing average excess fill to 0.5 ml lowers that figure to 500 litres, a 75% reduction in overfill.
Accurate filling and capping equipment can therefore influence sustainability beyond the electricity shown on the machine nameplate. Filling accuracy controls product giveaway, while repeatable cap placement and torque reduce leaking or incorrectly closed containers. At 12 million containers per year, lowering closure-related rejects from 0.8% to 0.3% avoids about 60,000 rejected units.
Reject prevention becomes more important as production speed rises. At 200 packages per minute, an undetected fault lasting five minutes can affect as many as 1,000 packages. Sensors for product presence, film registration, cap presence, seal temperature, pressure, label position, and container spacing can stop or correct production before a short fault continues for 20 or 30 minutes.
| Operating measure | Example baseline | Improved condition | Annual effect at stated volume |
|---|---|---|---|
| Average electrical demand | 20 kW | 16 kW | 24,000 kWh less at 6,000 h/year |
| Film per pack | 10.0 g | 9.9 g | 2,000 kg less at 20 million packs |
| Reject rate | 2.0% | 1.0% | 100,000 fewer rejects per 10 million cycles |
| Average overfill | 2.0 ml | 0.5 ml | 1,500 L less per 1 million fills |
| Idle operation | 600 h/year | 300 h/year | 50% fewer idle hours |
Electrical efficiency cannot be separated from compressed air. The U.S. Department of Energy has long treated compressed-air systems as an area where industrial facilities can reduce energy use through better system management, leak control, and appropriate pressure. Packaging machines commonly use air for cylinders, gripping, blowing, sealing assistance, or container handling, so equipment specifications should state consumption in normal litres or cubic feet per minute at a defined pressure.
Leakage makes the comparison more important. A machine requiring 6 bar when the process could operate reliably at a lower specified pressure asks the compressor system to supply more pressure than necessary. Replacing selected pneumatic movements with electric actuators can also reduce air demand, although engineers should compare cycle rate, maintenance requirements, electricity use, and expected service life rather than assuming one technology is always better.
Idle periods offer another measurable opportunity. A line scheduled for 6,000 hours may spend 10–20% of that time waiting for upstream product, downstream capacity, cleaning, material replenishment, or operator intervention. Motors, heaters, vacuum pumps, and conveyors that remain fully active during 900 idle hours can consume a substantial share of annual electricity without producing saleable packages.
Automatic standby control can stop conveyors, reduce selected heater setpoints, switch vacuum equipment according to demand, and place motors into low-power states after a defined delay. If non-production demand falls from 12 kW to 4 kW during 900 annual idle hours, electricity use falls by 7,200 kWh. Idle-state power should therefore appear in equipment comparisons alongside maximum production power.
Monitoring provides the numbers needed to verify those savings. Modern PLCs and plant monitoring systems can record kWh, accepted packages, rejects, downtime, temperature, machine state, air pressure, and material consumption. Comparing a 2025 monthly baseline with 2026 production data is more useful than relying on a single factory acceptance test because seasonal schedules, product formats, operators, and maintenance conditions can change consumption.
A practical KPI set can remain small: kWh per 1,000 accepted packages, grams of packaging per accepted unit, reject percentage, litres of compressed air per cycle, average overfill, and idle-energy percentage. If electricity per 1,000 packs rises 12% while output and package format remain unchanged, maintenance staff have a defined reason to inspect heaters, motors, bearings, vacuum equipment, air leakage, or machine settings.
Equipment life also belongs in the calculation. Industrial packaging machinery may remain in service for 10–20 years when properly maintained, so annual differences accumulate. A line saving 20,000 kWh each year reaches 200,000 kWh over 10 years before any additional savings from lower material consumption, fewer rejects, or reduced compressed-air use are counted.
Long service life works better when machines can accommodate future formats. Servo adjustment, stored recipes, replaceable tooling, software updates, and modular filling, sealing, labeling, or inspection stations can reduce the need to replace an entire line after a package redesign. A manufacturer introducing 5 or 10 product formats can retrieve validated parameters rather than rebuilding settings manually for every production change.
Procurement should therefore compare total operating requirements under the same test conditions. Suppliers can be asked to state electricity at rated speed, standby demand, compressed-air pressure and flow, accepted output per minute, changeover duration, material tolerances, reject performance, and measurement conditions. A claim of “30% lower energy use” has little engineering use unless the reference machine, production rate, package size, test duration, and included auxiliary equipment are stated.
A useful factory test might run 10,000 or 50,000 packages at the planned production speed and record accepted units rather than gross machine cycles. Electricity, compressed air, film or container consumption, rejects, stoppages, and changeover losses can then be divided by accepted output. Repeating the measurement after 6 or 12 months shows whether factory performance remains close to the commissioning figures.
Carbon reporting adds another reason to keep energy records. Under the GHG Protocol framework, purchased electricity is accounted for within Scope 2 emissions, so reducing packaging-line electricity can lower the electricity-related emissions associated with manufacturing. The exact reduction depends on the electricity source; saving 25,000 kWh does not produce the same emissions result in every country or electricity market.
Material savings also extend outside the packaging room. Removing 10 tonnes of annual film reduces the amount of material that must be produced, transported, stored, handled, and eventually collected or treated. Engineers should still verify barrier performance, seal strength, transport damage, shelf life, and food or pharmaceutical requirements where applicable, because a 5% material reduction that raises product losses would give a poor overall result.
Production quality, energy use, and material use therefore need to be evaluated together. A machine running 10% faster is not necessarily more efficient if rejects rise from 1% to 4%; a machine using 15% less electricity is not necessarily preferable if it consumes substantially more film or causes frequent stoppages. Comparing kWh, material, product loss, air consumption, and accepted throughput under the same operating conditions gives manufacturers a defensible basis for selecting and improving automatic packaging equipment.